


Morse Measurements Demonstrates How K&C Testing Reveals What a Race Car Is Really Doing Under Load
In race car development, suspension geometry on paper is only part of the equation. What ultimately matters is what happens to the complete vehicle when real-world cornering, braking, traction and aerodynamic loads are applied.
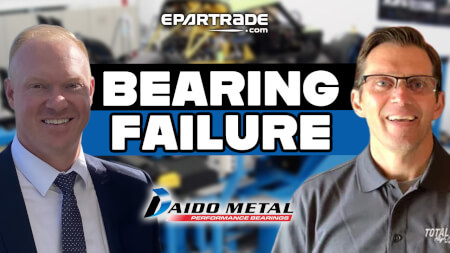
During a recent EPARTRADE Race Industry Now webinar, “Dialing In Dynamics: K&C Testing Insights,” Morse Measurements President Bob Simons and K&C Lab Manager Sonja Atkins provided an in-depth look at how Kinematics & Compliance (K&C) testing allows race engineers to measure those effects—and uncover suspension behavior that may be difficult or impossible to isolate at the racetrack.
Hosted by Brad Gillie of SiriusXM Channel 90, Late Shift, the presentation included live demonstrations from Morse Measurements’ Salisbury, North Carolina facility, where the company has been testing race cars for more than 20 years.
Going Beyond the Pull-Down Rig
Morse Measurements operates a Suspension Parameter Measurement Machine (SPMM), a K&C test system manufactured by Anthony Best Dynamics in the UK. While commercially available K&C systems were originally developed primarily for production vehicles, Morse Measurements has spent two decades adapting the technology specifically for motorsports applications.
That has included developing race car-specific chassis mounting methods, wheel measurement fixtures, spike plates to transmit high tire loads, mechanic work platforms and real-time data visualization.
The fundamental difference between K&C testing and more familiar race shop tools such as a pull-down rig is the ability to introduce forces that more closely represent what the suspension experiences on track.
“The thing that makes it really unique is it’s the only form of testing where you can actually apply lateral load, longitudinal load and tractive loads to the car on the rig and measure how the suspension is responding,” Simons explained.
A conventional pull-down rig primarily applies vertical displacement. K&C testing adds lateral, braking and tractive forces, allowing engineers to examine suspension behavior under combined loading conditions.
The advantage is repeatability. Track testing introduces changing temperatures, tire wear, track conditions, driver variation and countless other variables. On the K&C rig, engineers can repeat a controlled load case and objectively measure the effect of a setup change.
“You put the car on this rig and you measure how the suspension performs, and then you start making changes,” Simons said. “You understand what all those setup changes do objectively with real measurements.”
That means the team can arrive at the racetrack already knowing what a mechanical change actually does, leaving valuable track time for tuning rather than basic characterization.
Measuring Six Degrees of Wheel Motion
For the live demonstration, Morse Measurements used its in-house 2001 Laughlin Cup chassis.
The car was rigidly attached to the rig’s movable center table, which can generate bounce, pitch and roll independently or in combination. Each wheel was positioned on an individual ground-plane pad capable of lateral, longitudinal and rotational movement.
Wheel position is tracked through high-resolution digital string encoders. Using the measured string lengths, the system calculates the wheel center’s X, Y and Z position along with toe, camber and wheel rotation, providing a six-degree-of-freedom measurement of wheel motion.
Each wheel pad incorporates four Kistler multi-axis load cells. The system measures X, Y and Z forces and moments, as well as the position of the tire’s center of pressure.
To transmit race-level forces through the tire without losing grip between the tire and pad, Morse Measurements uses specialized spike plates.
A robotic steering system provides another layer of repeatability. Rather than relying on a human driver to reproduce steering inputs, the robot can execute precisely programmed steering commands while other forces are simultaneously applied to the vehicle.
Measuring Compliance Under Lateral Load
During a lateral test demonstrated live during the webinar, the chassis was held fixed while lateral force was introduced through the tire contact patches.
The resulting measurements reveal just how much the suspension and steering system move when loaded.
One key parameter is steer compliance—the change in wheel steer angle as lateral force increases. Engineers can establish a rate and compare the left and right sides of the vehicle for asymmetry.
The data can even reveal characteristics such as lash within the steering system.
Camber compliance similarly quantifies how camber changes as lateral load is applied. Simons noted that the magnitude of these changes can sometimes surprise teams, even on purpose-built race cars with rigid suspension components and no production-style rubber bushings.
“The amount of change in camber and steer can sometimes be shocking,” he said. “You don’t anticipate it to move that much.”
That distinction is critical: the suspension geometry that exists statically is not necessarily the geometry the tire sees while the car is generating substantial lateral force.
Finding the Force-Based Roll Center
K&C testing can also measure the jacking forces generated by suspension geometry.
As lateral force is applied, the rig measures the corresponding change in vertical wheel load. From the slope of that relationship, Morse Measurements calculates what it calls the anti-roll angle.
That angle can then be projected from the measured tire center-of-pressure position toward the vehicle centerline to determine a force-based roll center height.
Rather than relying solely on a geometrically calculated roll center derived from nominal suspension pickup points, the measurement shows how the complete physical vehicle actually reacts under load.
Simons described this as the “real roll center height”—the roll center represented by the car’s measured force response.
Roll Stiffness, Roll Steer and Camber Recovery
Morse Measurements also demonstrated a chassis roll test.
As the chassis rolls, the individual wheel pads follow the tires while maintaining essentially zero scrub force. Simultaneously, the system records wheel motion and loads.
From the test, engineers can determine front, rear and total roll stiffness.
Anti-roll bar contribution can also be isolated. Morse Measurements can run the vehicle with the anti-roll bars connected and disconnected, then quantify exactly how much each bar contributes to the vehicle’s total roll stiffness. Different bar diameters or adjustment positions can then be systematically mapped.
Another output is roll steer, including both its magnitude and direction. Left-to-right differences can immediately identify asymmetries that warrant further investigation.
Camber recovery is also measured.
If the chassis rolls but wheel camber relative to the ground remains unchanged, the suspension has 100% camber recovery. If wheel camber changes by the same amount as chassis roll, recovery is 0%. Real vehicles generally fall somewhere between those two extremes.
Tire Stiffness and Pressure Effects
Although the K&C rig is not intended to replace a dedicated tire testing machine, the system can measure tire stiffness vertically, laterally, longitudinally and in twist.
That makes it possible to evaluate how tire pressure influences those stiffness characteristics.
Most race teams, Simons explained, conduct K&C testing at expected hot tire pressures to represent the condition the vehicle will experience after the tires reach operating temperature. But the same test can be repeated at lower pressures to examine how the vehicle behaves earlier in a run.
For engineers trying to understand the interaction between tire stiffness, suspension compliance and vehicle response, those comparisons can provide another useful layer of data.
Simulating the Middle of a Corner
Perhaps the most comprehensive demonstration involved Morse Measurements’ cornering simulation.
Rather than reproducing an entire lap, the K&C rig can recreate specific vehicle states such as corner entry, mid-corner or corner exit.
During the steady-state cornering demonstration, the rig simultaneously applied roll moment to the chassis and lateral load at the tire contacts while the steering robot introduced steering input.
Aerodynamic downforce can also be incorporated. If a team knows the front and rear downforce corresponding to a particular vehicle speed or corner, those loads can be applied during the test. Simulated tire pneumatic trail can also be included.
The result is a controlled laboratory recreation of the forces acting on the suspension during a specific portion of a corner.
One demonstration made the importance of combined loading particularly clear.
After running a cornering simulation with lateral force applied, Morse Measurements replayed the exact chassis motion without the lateral load. Despite identical chassis displacement, the resulting loads and measured rates were substantially different.
“That illustrates why it’s so important to test the car with the loads in it and know what it’s really doing,” Simons explained.
For race engineers, that comparison highlights an important limitation of evaluating suspension purely through displacement. Moving a suspension through its travel does not necessarily reproduce its behavior when real forces are passing through the tire contact patch, wheel bearings, uprights, steering system, links and chassis.
When the Car Doesn't Follow the Math
Some of the most valuable K&C sessions begin when a race car behaves differently from what the engineering model predicts.
Simons recalled one vehicle suffering from a braking-related handling problem. The car used a strut suspension that appeared to operate normally until braking load was introduced.
Testing revealed that the strut was binding specifically under braking force. Under other conditions the suspension moved properly, but once loaded longitudinally during braking it resisted movement, causing the front of the car to lose grip.
Another team changed its suspension geometry intending to reduce anti-squat. Based on the geometry and calculations, the modification should have increased squat.
On track, the opposite happened.
The team initially questioned its calculations, but after reviewing the geometry, the math still appeared correct. K&C testing was then used to determine why the actual vehicle was responding differently from the theoretical expectation.
Cases like these illustrate one of the fundamental advantages of physical K&C measurement: models describe what a suspension should do based on their inputs and assumptions. The rig measures what the assembled race car actually does.
From Physical Measurement to Vehicle Models
Teams do not necessarily need to supply Morse Measurements with every suspension design parameter before testing. The K&C process measures the behavior of the suspension as an assembled system.
For teams seeking deeper correlation between simulation and physical testing, Morse Measurements can also provide coordinate measuring machine (CMM) services to determine the X, Y and Z locations of suspension hard points.
Those measurements can be used to compare the physical car against its design, compare multiple chassis, or construct a kinematic suspension model.
K&C measurements can then be used to validate that model.
The company also works with the Aerodyn facility in Mooresville, North Carolina, for center-of-gravity and moments-of-inertia measurements, providing additional parameters for vehicle dynamics modeling.
Turning Hundreds of Graphs Into Actionable Information
A typical race car can be mounted to the K&C rig in approximately two to three hours, depending on the vehicle. Once setup is complete, the individual tests themselves can be performed relatively quickly.
The challenge then becomes interpreting the volume of information generated.
Morse Measurements provides customers with the raw measurements and graphs, but also typically prepares an engineering summary report identifying the results its engineers believe deserve the most attention.
“There’s a huge amount of data here,” Simons said. “What we’re trying to do is highlight what we think is important and what they should be looking at.”
Engineers can also watch the results develop live during testing. If something unusual appears in a graph—or physically on the vehicle—the team can investigate immediately, make a change and repeat the measurement under the same controlled conditions.
And sometimes, simply standing beside the vehicle as race-level forces are applied can be revealing.
Suspension members deflect. Tires distort. Body and chassis panels move. Steering components react. Loads travel through structures in ways that may not be obvious from CAD models or static setup measurements.
As Simons noted, what engineers physically observe during the test can become a major part of what they take away from the session.
Replacing Guesswork With Measurement
K&C testing does not eliminate the need for track testing. Instead, it allows teams to move a significant portion of suspension development into a repeatable laboratory environment.
For professional teams, Simons noted, K&C testing can also be considerably less expensive than track testing. There is no engine mileage, fuel consumption, tire consumption or requirement to transport a full crew to a circuit simply to determine the mechanical effect of a setup change.
More importantly, it allows engineers to separate two questions that are often mixed together at the racetrack: What does this setup change mechanically do to the car, and does the driver or stopwatch prefer the resulting behavior?
By answering the first question before arriving at the circuit, teams can use their limited track time to concentrate on the second.
From steer and camber compliance to jacking forces, force-based roll centers, roll stiffness, anti-roll bar contribution, tire stiffness, camber recovery and combined-load cornering behavior, the K&C rig provides a detailed picture of how a race car responds when subjected to forces that more closely resemble those it experiences on track.
And when the physical car refuses to behave the way the calculations say it should, the ability to reproduce those loads in a controlled environment can provide the most valuable measurement of all: an explanation of why.
For more information, watch the full webinar here.